
Statistics Assignment: Frequency Tables, Mean, Median & Variance
QUESTION ONE
A campus parcel collection centre recorded the waiting time (in minutes) for 25 students collecting online orders during a busy registration week. The waiting times are shown below:
| 17 | 21 | 34 | 29 | 26 |
| 18 | 23 | 31 | 27 | 35 |
| 24 | 20 | 28 | 32 | 25 |
| 19 | 30 | 22 | 33 | 27 |
| 24 | 36 | 21 | 29 | 26 |
- Classify the type of data above and justify your answer. (2)
- Construct a grouped frequency distribution table using the following guidelines:
- The lowest class interval must be 15 < 20.
- Use a class width of 5.
- Your table must include class intervals, frequency and cumulative frequency. (6)
- Using the grouped data from Question 1.2, construct an ogive curve. (5)
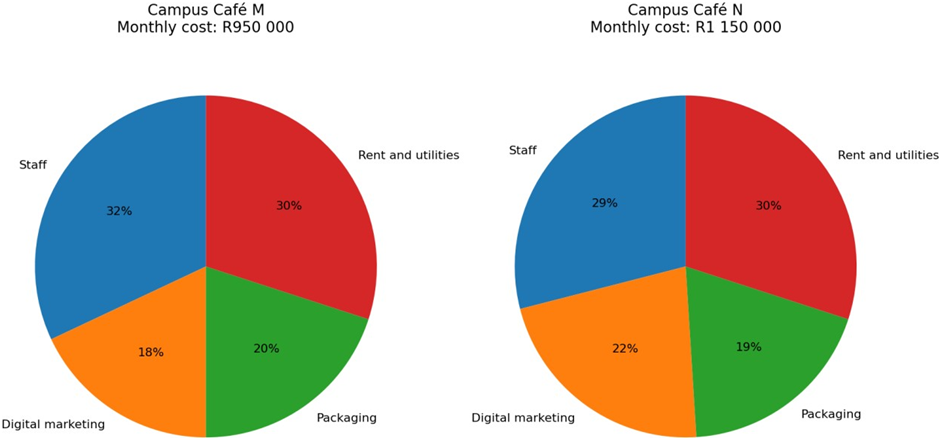
- Two campus cafés, Café M and Café N, operate near the same university. Their monthly operating costs are R950 000 and R1 150 000 respectively. The pie charts below summarise how each café allocates its monthly expenditure across different cost categories.
- Calculate how much more or less Café N spends on staff compared to Café M. (5)
- Determine the difference in the combined expenditure on digital marketing and packaging between Café M and Café N. (5)
- State the level of measurement best represented by a pie chart and explain. (2)
QUESTION TWO
The following data represents the weekly transport spending (in rand) of thirteen B.Com students travelling to campus:
| 240 | 225 | 195 | 150 | 260 | 165 | 175 | 185 | 145 | 210 | 130 | 115 | 150 |
- Calculate the mean weekly transport spending. (2)
- Calculate the median and interpret the result in context. (3)
- Calculate the sum of the range and the mode. (2)
- Calculate the 62nd percentile and interpret its meaning in the context of weekly transport spending.
- Calculate the variance. (5)
- Calculate the coefficient of variation. (3)
- Calculate the interquartile range and comment on what it reveals about the spread of weekly transport spending. (6)
QUESTION THREE
The table below shows the number of student help-desk queries handled per day at a university service centre, recorded over a sample of 100 days. One class frequency is missing and must be determined before the data can be analysed.
| Number of queries | Number of days |
| 40 < 50 | 8 |
| 50 < 60 | 19 |
| 60 < 70 | ? |
| 70 < 80 | 27 |
| 80 < 90 | 10 |
- Determine the missing frequency. (2)
- Calculate the mean number of queries handled per day. (3)Determine the mode. (3)Calculate the median. (4)
- Calculate the coefficient of variation and critically interpret what it indicates about the consistency of daily help-desk demand. (8)
Experts Answer on Above Questions on Statistics
Type of data
The waiting times are classified as quantitative continuous data because it is numerical and it can take any theoretical value within a range including decimals.
Grouped frequency distribution
The group frequency distribution is 25 using class width of 5.
Staff expenditure – Cafe N vs Cafe M
The calculations indicate that Cafe M allocates 32% to staff and Cafe N allocates 29%.So for Cafe M, 32% of R950000 is R304000 and Cafe N at 29% of R1150000 is R333500. The difference is R333500-R304000 = R29500. This implies that Cafe N spends R29500 more on staff than Cafe M.
Digital marketing and packaging
For Cafe M, digital Marketing is 18%, packaging is 20% and combined 38% of R950000 which is R361000.
For Cafe N, digital marketing is 22% and packaging is 19% and the combined is 41% of R1150000 = R471500. The difference is R471500-R361000 = R110500
This implies that Cafe N spends R110500 more on digital marketing and packaging combined.
Level of measurement – the pie chart clearly indicates the nominal/ categorical data when the categories are mutually exclusive expenditure groups. The percentage also clearly indicates each category’s proportion of the total.
Calculation of mean – the mean value comes to 180.38 which indicates that the mean weekly transport spending is R180.38
Calculation of median – there are 13 observation so the median is the 7th value which is R175 and it indicates that half of the students spend R175 or less per week while other half spend R175 or more.
Range + mode – The range is 260 – 115 – 145 and the mode is 150. Therefore 145+150 is R295
62nd Percentile – the 62nd percentile lies between the 8th value (R185) and 9th value (R195) which is R191.80.
It implies that 62% of the students spend R191.80 or less per week.
Coefficient of variation – the coefficient of variation is 23.41% which implies that the weekly transport spending is approximately 23.4% relative variability, indicating a moderate spread around the mean.
Interquartile range – the interquartile range is R70 which indicates that the middle 50% of the students spend between R147.50 and R217.50, giving a middle spending spread of R70.
Missing frequency
The total frequency is 100 and the known frequencies are 8+19+27+10-64 Therefore 100-64 = 36 which indicates missing frequency is 36 days.
Mean – The mean calculation of class midpoints is 66.2 which indicates there are 66.2 queries per day.
Mode – The calculation of mode as included in the appendix shows 76.54 with frequency of 36.
Median – The median is 66.39 showing there are 66.39 queries per day.
Coefficient of variation – the coefficient of radiation is calculated as 16.31% which indicates relatively low to moderate variability.
| This model answer is reviewed by Nkosikhona Mthombeni, bachelor in accounting, having sound understanding of statistical techniques and measures. Disclaimer: This answer is a model for study and reference purposes only. Please do not submit it as your own work. |
Want Detailed Answers with References?
The statistics questions on Frequency distribution, ogive, mean, median, variance, percentiles, CV and grouped data above indicated important findings related to the case information. If you are looking for a similar kind of assistance with your statistics assignment, get in touch with our expert by visiting the South African assignment writing service page. Also access the solved assignment answers from Regent Business School to analyse our writers credentials.
Why Students Choose Us
Need Help With Similar Statistics Assignment?
Hire a professional statistics assignment expert to perform statistical analysis on data using measures like mean, median and mode, co-efficient of variation, range and many more.
- Professional Statisticians
- Utilise Statistical Techniques
- Highly Relevant & Accurate
- Statistics Case Study & Reports