
Demand, Elasticity & Monopoly Economics Assignment
SECTION A: DEMAND CURVES & MARKET STRUCTURES (40 MARKS)
1. Discuss demand curves in terms of their different possible shape, form and slope tendencies. Where relevant, refer to how these tendencies relate to the demand curves of firms operating in the different market structures, and provide full reasons. No diagrams are required.
SECTION B: EQUILIBRIUM & ELASTICITIES SCENARIO
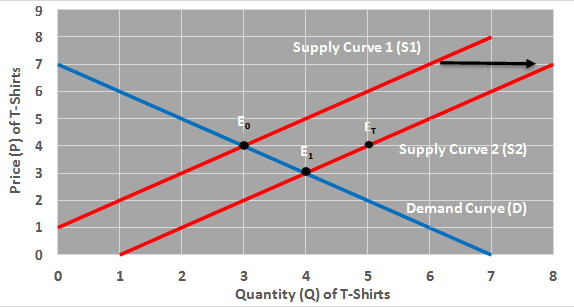
- The market clearing mechanism is a very important part of free-market economics. Discuss the market clearing mechanism with reference to the above diagram (and all its labelled components). In response, ensure that the following issues are addressed:
- What market clearing means and the two functions played by the price in the mechanism
- The original balance in terms of its definition and what it means
- The change that occurred in terms of its name and what it means
- The possible causes of the change (shock)
- How the model reverts to a new balance
- Use any of the two elasticity formulas to calculate and comment on the price elasticity of demand between the two successive points of equilibrium.
SECTION C: MONOPOLY MARKET STRUCTURE
With reference to a diagram, discuss how economic profit is determined for a firm operating as a monopoly.
Experts Answer on Above Questions on Economics
Demand curves and market structure
Demand curve – shape, form and slope
A demand curve mainly indicates the quantity of goods consumers are willing and able to buy at different prices by taking into consideration the other factors constant.
Different types of demand curve indicate different interpretations, as a downward sloping demand implies that the lower prices increase the quantity demanded, and it reflects the law of demand. Steep demand curve indicates the quantity demanded changes relatively little as compared to changes in price, and it is directly related to inelastic demand. Flat demand curve implies that the quantity demanded responds strongly to price changes, and thereby represents relatively elastic demand. A vertical demand curve indicates perfectly inelastic demand and the quantity demanded remains unchanged despite changes in the price. Finally, the horizontal demand curve reflects perfectly elastic demand.
The shape of the demand curve differs significantly across market structures, such as a horizontal demand curve in case of a perfectly competitive firm while a downward sloping demand curve in monopolist market conditions. In monopolistic competition, the differentiated firm faces a download sloping demand curve while in oligopoly, the shape of the demand curve depends on how competitors respond to price changes.
Equilibrium and Elasticities
Market clearing mechanism – it is defined as a process in which changes in price coordinate quantity demanded and quantity supplied until the market reaches an equilibrium. The quantity demanded equals the quantity supplied at the original equilibrium. There are two important functions performed by the equilibrium price such as acting as a signal, communicating information about scarcity and consumer demand to buyers and suppliers, and secondly to act as an incentive whereby to encourage consumers and producers to change their behavior in the instances of changing market conditions.
However the market experiences a shock when the external change affects demand or supply. In case of shortage, there is a pressure on the price. As the price increases, the quantity demanded falls while the quantity supplied rises. This adjustment continues until a new equilibrium is reached where the new quantity demanded again equals the new quantity supplied. This implies that the market moves from original equilibrium – market shock – disequilibrium – price adjustment – new equilibrium.
Price elasticity of demand between the two equilibria
It is mainly the price and the quantity coordinates that determines the appropriate calculation and the percentage change in the quantity demanded needs to be compared with the percentage change in the price between the two successive equilibrium points.
Monopoly Market structure
With respect to a monopolist, the demand curve of a firm is downward sloping and represents the market demand it faces. However it is important for their monopolist to lower its price in order to sell additional units, as its marginal revenue curve lies below the demand curve.
| The above model answer is reviewed by Phindile Rachel, management expert, having sound understanding of international management including economics concepts. Disclaimer: This answer is a model for study and reference purposes only. Please do not submit it as your own work. |
Want Detailed Answers with References?
With professional economics experts, you have the opportunity to analyse in detail the important economics concepts including demand curve, market equilibrium, price elasticity and Monopoly profit using economic theory and market clearing mechanism. Visit our assignment help in South Africa page to get a professional economics expert for your assignment. Before deciding on choosing our services, you can explore the quality of writing by checking answers written by experts for questions from Richfield.
Why Students Choose Us
Need Help With Similar Economics Assignment?
Get a South African economics expert to analyse demand curves, market clearing mechanism, price elasticity of demand and monopoly market structure.
- South African Economics Experts
- Applies Diagrams & Charts
- Step-by-Step Analysis
- Case Study & Report Writing
Related answers
 Grab, Monopoly, GDP & Monetary Policy Assignment
- Economics Case Study: Shoprite, Sasol & Takealot
- Microeconomics Supply & Demand Assignment Ireland
- Production Possibilities Frontier & Opportunity Cost Case Study
- Phillips Curve, Inflation, Unemployment & Policy Assignment
- South Africa, Digital Trade & Global Business Assignment
- Oil Prices, Fuel Subsidies & EV Assignment Malaysia
- National Minimum Wage & Labour Market in South Africa
- TMF2964 Smart City Parking e3value Model & NPV Analysis